Competitive multiplayer gaming evolves fast—and if you’re here, you’re looking for a clear edge. Whether you’re preparing for your next tournament, climbing ranked ladders, or adapting to shifting platform metas, this article is built to give you actionable insights that translate directly into wins.
We break down the latest multiplayer platform trends, dissect emerging strategies, and spotlight the tactical adjustments that separate consistent contenders from early eliminations. From draft priorities to late-game execution, every section is designed to align with what competitive players are actively searching for: smarter decisions, stronger coordination, and measurable improvement.
Our insights are grounded in high-level match reviews, scrim data, patch-by-patch comparisons, and direct analysis of tournament play. We combine expert breakdowns with win condition statistical analysis to ensure the strategies discussed aren’t just popular—they’re proven.
If you want clarity on what’s working right now, why it works, and how to apply it in your next event, you’re in the right place.
Beyond Intuition: Finding the Winning Formula in the Numbers
Understanding the statistical analysis of win conditions in team-based games not only enhances strategic planning but also underscores the importance of Managing Nerves and Fatigue During Multi-Day Gaming Events, where mental clarity can significantly impact a team’s performance.
Most players trust instinct. Sometimes that works. Often, it doesn’t. Gut feelings feel right—but feelings aren’t frameworks.
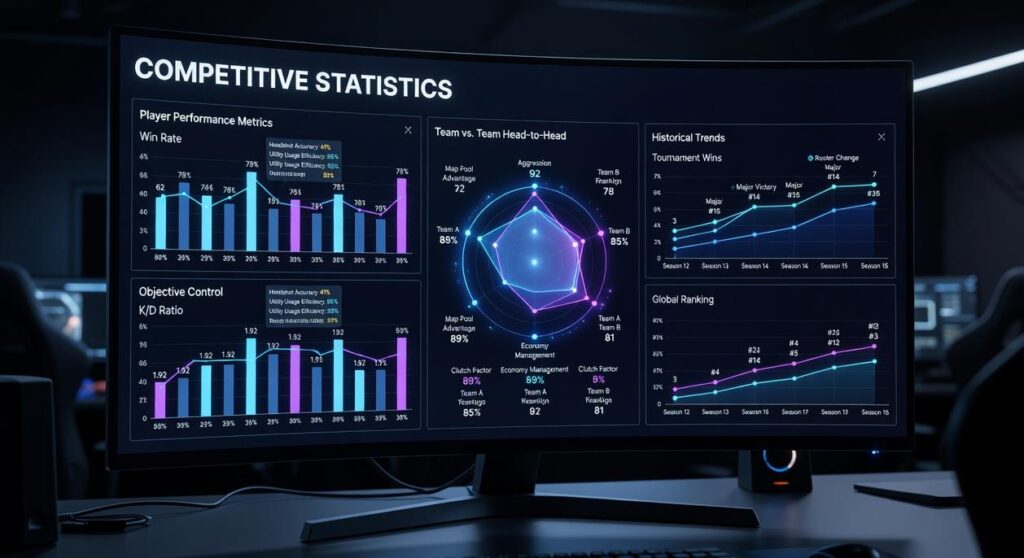
The alternative is win condition statistical analysis: systematically reviewing match data to uncover repeatable patterns that lead to victory. In esports, analysts track variables like economy timing, objective control rates, and positioning efficiency to isolate what actually drives wins (as seen in performance breakdowns from major tournament broadcasts).
Is data everything? Not quite. Context matters, and small sample sizes can mislead.
Start simple:
- Track outcomes
- Identify repeatable triggers
- Adjust and retest
You move from guessing to knowing.
Step 1: Defining Your Data Universe – What to Track and Why
Before you dive into spreadsheets like a wizard hoarding arcane scrolls, define your data universe. That simply means deciding what you’ll measure—and why it matters.
Identifying Key Performance Indicators (KPIs)
A Key Performance Indicator (KPI) is a measurable value that shows how effectively you’re achieving a goal. In competitive games, that goes far beyond Kill/Death ratios (because padding stats in a losing effort is the digital equivalent of flexing at the wrong time).
Track metrics like:
- Objective control time
- Resource generation rates (gold per minute)
- Ability accuracy percentages
- Positional heatmaps
These reveal patterns. If your gold per minute spikes when rotating early, that’s actionable. If your ability accuracy tanks under pressure… well, we’ve found your training arc.
Win Conditions vs. Vanity Metrics
A win condition is the measurable path that consistently leads to victory. A vanity metric looks impressive but doesn’t impact outcomes. High K/D? Cool. First objective secured 78% of wins? Now we’re talking. This is where win condition statistical analysis separates highlight reels from actual progress.
Data Collection Methods
Use in-game APIs, third-party tools like OP.GG, Dotabuff, or WCL, or even manual spreadsheets (yes, Excel warriors exist).
Context Is King
Data without context is trivia. A strategy dominating one map or team composition may flop elsewhere. Numbers tell stories—but only if you read the whole page.
Step 2: Core Statistical Concepts for Competitive Analysis

Before you tweak another strategy, you need to understand the numbers behind your wins and losses. Otherwise, you’re just guessing (and hoping the matchmaking gods are kind).
Correlation vs. Causation
First, the big one. Correlation means two things happen together. Causation means one directly causes the other. High damage output often appears in winning matches—but does damage cause the win, or does winning create more opportunities to deal damage?
Some players argue that if a stat shows up in every victory, it must be the reason. Not necessarily. To test causation, isolate variables. For example, compare matches where early vision control was prioritized versus ignored—while keeping team composition consistent. Patterns that persist under controlled conditions are far more convincing.
Regression Analysis (Simplified)
Next, regression analysis helps estimate relationships between variables. If a 10% early-game resource lead results in a 20% increase in win probability, that’s actionable insight. In practice, this is win condition statistical analysis—identifying which measurable advantages most reliably convert into victories.
Critics say this is overkill for ranked play. But even simple trend tracking in a spreadsheet can reveal which metrics actually move the needle.
A/B Testing Your Strategies
Now, test systematically. Play 10 matches using an aggressive early push (Strategy A) and 10 using passive scaling (Strategy B), holding role and teammates as constant as possible. Then compare win rates and objective control. This mirrors the approach outlined in coaching insights turning loss reviews into performance gains.
Standard Deviation and Consistency
Finally, standard deviation measures variability. A low standard deviation in gold per minute or objective timing means consistency—making improvement easier and more predictable. High variance? That’s volatility (fun in highlight reels, harder in tournaments).
In competitive play, consistency beats chaos more often than not.
Step 3: Case Study – Analyzing a Multiplayer Match
Start with an anecdote about X: I once reviewed a 5v5 ranked match in League of Legends where our draft looked doomed in chat (you know the type—three scaling picks and instant panic). But drafts aren’t vibes; they’re probabilities.
Pre-Game Analysis
In a MOBA (Multiplayer Online Battle Arena, a team-based strategy game focused on objectives), composition defines your win condition—the specific scenario most likely to secure victory. Our scaling comp had a 54% win rate against early-game skirmish teams in similar tiers. The key carry? Our late-game ADC, statistically strongest past 25 minutes. That’s win condition statistical analysis in action: identify the role whose power spike correlates with historical wins.
- Protect the ADC through early vision control
- Avoid coin-flip fights before two-item spike
- Trade objectives instead of contesting blindly
(Pro tip: If your comp scales, time is an asset—treat it like gold.)
Mid-Game Pivot Points
At 15 minutes, the data becomes sharper. The team that secured the first epic monster has a 70% historical win rate. That objective—Dragon or Roshan—creates measurable momentum. Forcing this condition means:
- Shoving side waves first
- Establishing deep vision
- Baiting cooldowns before committing
Think of it like setting up the final battle in Avengers: Endgame—you don’t charge Thanos without the full squad.
Post-Game Breakdown
Skip the KDA scoreboard. Study gold and XP graphs. In our case, the insurmountable lead began after a 17-minute team fight that converted into both Dragon and mid-tier tower. That spike—not the flashy pentakill—was the real target condition.
For deeper champion data, review match trends on platforms like League of Legends.
Step 4: Common Pitfalls and Tools for Your Arsenal
Confirmation Bias is the habit of favoring data that confirms your beliefs while ignoring disconfirming evidence (we have all been there). Stay objective.
Small Sample Sizes mean drawing conclusions from only a handful of matches; without win condition statistical analysis across a meaningful dataset, variance masquerades as truth.
Analysis Paralysis is overthinking every variable until you miss the meta shift (yes, like waiting for the perfect patch).
Helpful tools:
- Google Sheets or Excel for tracking KPIs and building simple dashboards.
Pro tip: Review metrics weekly, not after losses. Stay disciplined.
From analysis to action, you now hold a practical framework for turning match data into smarter decisions. Instead of guessing why you stall, you can apply win condition statistical analysis to pinpoint the moments, resources, and rotations that consistently lead to victory. Some argue instinct and “feel” matter more, but data reveals patterns instinct often misses. Track three key metrics across your next ten matches, compare wins versus losses, and identify one repeatable edge. • Focus on replicating that condition under pressure. Small, measured adjustments compound into higher win rates over time. Consistency beats hype every single season. That’s sustainable.
Turn Insight Into Your Next Competitive Edge
You came here to understand how to read the meta, break down multiplayer trends, and sharpen your tournament strategy. Now you have the framework to do exactly that.
The difference between consistent contenders and early eliminations often comes down to preparation. Without clear data, refined tactics, and a deep grasp of shifting platform dynamics, even skilled players fall short when it matters most. That frustration—knowing you could have played better with the right insights—doesn’t have to define your next event.
The solution is simple: apply structured preparation, leverage win condition statistical analysis, and approach every match with a data-backed plan instead of guesswork. When you align your strategy with proven patterns and real competitive trends, you stop reacting and start dictating outcomes.
Now it’s time to act. Dive deeper into advanced breakdowns, study upcoming event formats, and refine your tournament playbook before your next bracket locks in. Join thousands of competitive players who rely on expert-driven insights to stay ahead of the meta—get the edge, prepare smarter, and step into your next match ready to win.
 Patriciavina McMillan writes the kind of expert breakdowns content that people actually send to each other. Not because it's flashy or controversial, but because it's the sort of thing where you read it and immediately think of three people who need to see it. Patriciavina has a talent for identifying the questions that a lot of people have but haven't quite figured out how to articulate yet — and then answering them properly.
They covers a lot of ground: Expert Breakdowns, Core Gaming Insights and Strategies, Multiplayer Platform Trends, and plenty of adjacent territory that doesn't always get treated with the same seriousness. The consistency across all of it is a certain kind of respect for the reader. Patriciavina doesn't assume people are stupid, and they doesn't assume they know everything either. They writes for someone who is genuinely trying to figure something out — because that's usually who's actually reading. That assumption shapes everything from how they structures an explanation to how much background they includes before getting to the point.
Beyond the practical stuff, there's something in Patriciavina's writing that reflects a real investment in the subject — not performed enthusiasm, but the kind of sustained interest that produces insight over time. They has been paying attention to expert breakdowns long enough that they notices things a more casual observer would miss. That depth shows up in the work in ways that are hard to fake.
Patriciavina McMillan writes the kind of expert breakdowns content that people actually send to each other. Not because it's flashy or controversial, but because it's the sort of thing where you read it and immediately think of three people who need to see it. Patriciavina has a talent for identifying the questions that a lot of people have but haven't quite figured out how to articulate yet — and then answering them properly.
They covers a lot of ground: Expert Breakdowns, Core Gaming Insights and Strategies, Multiplayer Platform Trends, and plenty of adjacent territory that doesn't always get treated with the same seriousness. The consistency across all of it is a certain kind of respect for the reader. Patriciavina doesn't assume people are stupid, and they doesn't assume they know everything either. They writes for someone who is genuinely trying to figure something out — because that's usually who's actually reading. That assumption shapes everything from how they structures an explanation to how much background they includes before getting to the point.
Beyond the practical stuff, there's something in Patriciavina's writing that reflects a real investment in the subject — not performed enthusiasm, but the kind of sustained interest that produces insight over time. They has been paying attention to expert breakdowns long enough that they notices things a more casual observer would miss. That depth shows up in the work in ways that are hard to fake.